释放双眼,带上耳机,听听看~!
可以参考:http://www.ttlsa.com/nginx/nginx-status-detail/
可以参考:http://www.ttlsa.com/zabbix/zabbix-monitor-nginx-performance/
通过status 模块监控 nginx
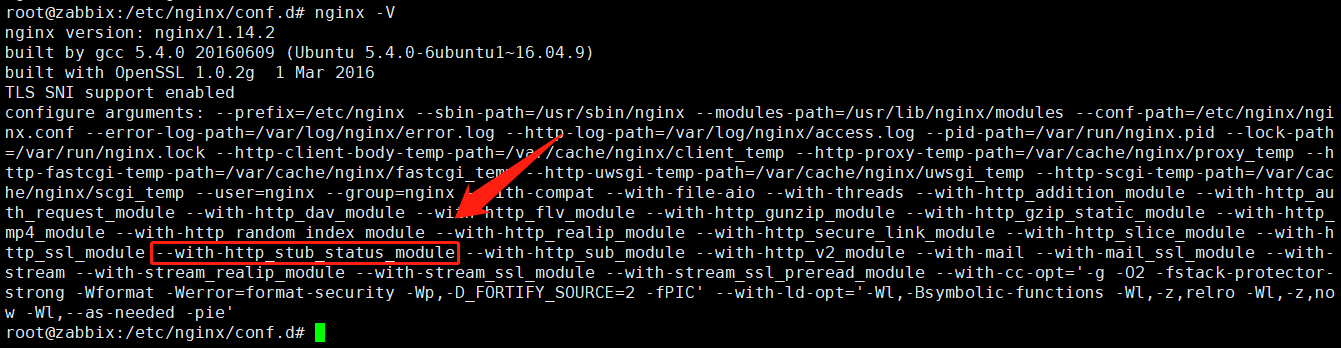
一、nginx配置
2
3
4
5
6
7
8
9
10
11
12
13
2server {
3 listen 8090 ;
4 server_name _;
5 location /stub_status {
6 stub_status on;
7 access_log off;
8 }
9}
10nginx: the configuration file /etc/nginx/nginx.conf syntax is ok
11nginx: configuration file /etc/nginx/nginx.conf test is successful
12root@zabbix:/etc/nginx/conf.d# nginx -s reload
13
二、测试
2
3
4
5
6
2Active connections: 2
3server accepts handled requests
4 16 16 336
5Reading: 0 Writing: 1 Waiting: 1
6
Active connections: 当前nginx正在处理的活动连接数.
**Server accepts handled requests request_time: **nginx总共处理了16个连接,成功创建16握手(证明中间没有失败的),总共处理了336个请求。
Reading: nginx读取到客户端的Header信息数.
Writing: nginx返回给客户端的Header信息数.
**Waiting: **开启keep-alive的情况下,这个值等于 active – (reading + writing),意思就是nginx已经处理完成,正在等候下一次请求指令的驻留连接。
所以,在访问效率高,请求很快被处理完毕的情况下,Waiting数比较多是正常的.如果reading +writing数较多,则说明并发访问量非常大,正在处理过程中。
三、自定义监控项:
2
3
2UserParameter=nginx.status[*],/opt/zabbix/zabbix_nginx.sh $1
3
监控脚本
2
3
4
5
6
7
8
9
10
11
12
13
14
15
16
17
18
19
20
21
22
23
24
25
26
27
28
29
30
31
32
33
34
35
36
37
38
39
40
41
42
43
44
45
46
47
48
49
50
51
52
53
54
55
56
57
58
59
60
61
62
63
64
65
66
67
68
69
70
71
72
73
74
75
76
2root@zabbix:~# cat /opt/zabbix/zabbix_nginx.sh
3#!/bin/bash
4##################################################
5# Description:zabbix 通过 status 模块监控 nginx
6# Note:Zabbix 3.2
7# DateTime: 2016-11-22
8##################################################
9
10HOST="localhost"
11PORT="8090"
12stub_status=stub_status
13
14#检测nginx是否挂掉
15function check() {
16 if [ -f /sbin/pidof ]; then
17 /sbin/pidof nginx | wc -w
18 else
19 ps ax | grep "nginx:" | grep -v grep | wc -l
20 fi
21}
22
23#检测nginx性能
24function active() {
25 /usr/bin/curl -s "http://$HOST:$PORT/${stub_status}/" 2>/dev/null| grep 'Active' | awk '{print $NF}'
26}
27function accepts() {
28 /usr/bin/curl -s "http://$HOST:$PORT/${stub_status}/" 2>/dev/null| awk NR==3 | awk '{print $1}'
29}
30function handled() {
31 /usr/bin/curl -s "http://$HOST:$PORT/${stub_status}/" 2>/dev/null| awk NR==3 | awk '{print $2}'
32}
33function requests() {
34 /usr/bin/curl -s "http://$HOST:$PORT/${stub_status}/" 2>/dev/null| awk NR==3 | awk '{print $3}'
35}
36function reading() {
37 /usr/bin/curl -s "http://$HOST:$PORT/${stub_status}/" 2>/dev/null| grep 'Reading' | awk '{print $2}'
38}
39function writing() {
40 /usr/bin/curl -s "http://$HOST:$PORT/${stub_status}/" 2>/dev/null| grep 'Writing' | awk '{print $4}'
41}
42function waiting() {
43 /usr/bin/curl -s "http://$HOST:$PORT/${stub_status}/" 2>/dev/null| grep 'Waiting' | awk '{print $6}'
44}
45
46case "$1" in
47 check)
48 check
49 ;;
50 active)
51 active
52 ;;
53 accepts)
54 accepts
55 ;;
56 handled)
57 handled
58 ;;
59 requests)
60 requests
61 ;;
62 reading)
63 reading
64 ;;
65 writing)
66 writing
67 ;;
68 waiting)
69 waiting
70 ;;
71
72 *)
73 echo "Usage $0 {check|active|accepts|handled|requests|reading|writing|waiting}"
74 exit
75esac
76
加执行权限:
2
2
重启zabbix-agent
2
2
手动测试:
2
3
4
5
6
7
8
9
22
3root@zabbix:~# zabbix_get -s 127.0.0.1 -p10050 -k nginx.status[check]
42
5root@zabbix:~# zabbix_get -s 127.0.0.1 -p10050 -k nginx.status[active]
66
7root@zabbix:~# zabbix_get -s 127.0.0.1 -p10050 -k nginx.status[accepts]
832
9
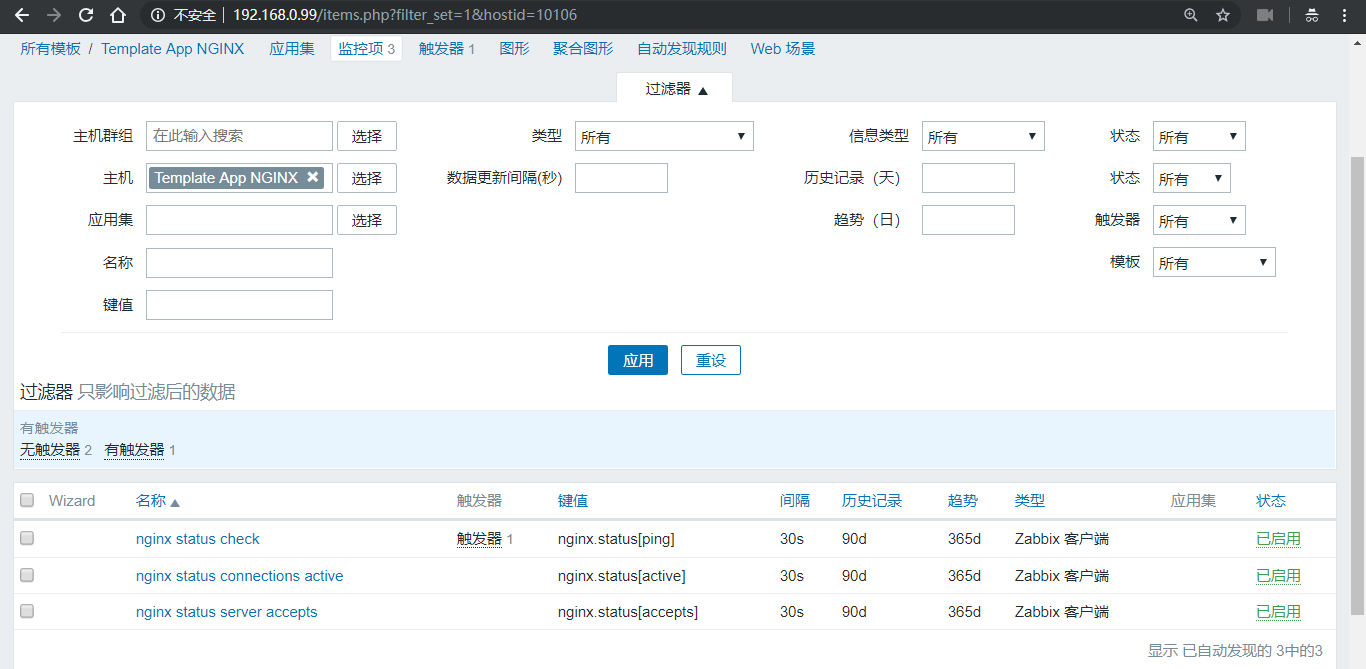
四、web界面定义监控项及触发器,写成模版
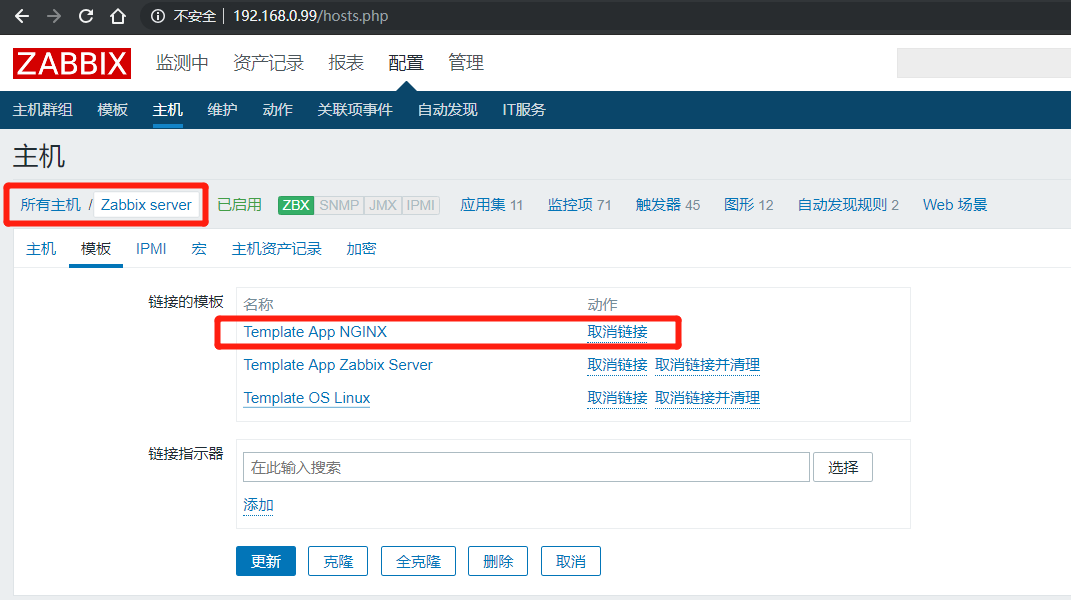
五、应用到主机上
六、手动停掉nginx看是否报警
监控项内容:

2
3
4
5
22018年 12月 24日 星期一 12:53:45 CST
3root@zabbix:~# zabbix_get -s 127.0.0.1 -p10050 -k nginx.status[check]
40
5