类型为Pods的指标数据来源于Pod对象本身,其中target指标类型只能使用AverageValue,示例如下
2
3
4
5
6
7
8
9
10
2- type: Pods
3 pods:
4 metric:
5 name: packets-per-second
6 target:
7 type: AverageValue
8 averageValue: 1k
9
10
其中,设置Pod的指标名为packets-per-second,在目标指标平均值为1000时触发扩缩容操作。
类型为Object的指标数据来源于其他资源对象或任意自定义指标,其中target指标类型可以使用Value或AverageValue(根据Pod副本数计算平均值)进行设置。下面对几种常见的自定义指标给出示例和说明。
例1:
2
3
4
5
6
7
8
9
10
11
12
13
2- type: Object
3 object:
4 metric:
5 name: requests-per-second
6 describedObject:
7 apiVersion: extensions/v1beta1
8 kind: Ingress
9 name: main-route
10 target:
11 type: Value
12 value: 2k
13
例1,设置指标的名称为requests-per-second,其值来源于Ingress “main-route”,将目标值(value)设置为2000,即在Ingress的每秒请求数量达到2000个时触发扩缩容操作。
例2:
2
3
4
5
6
7
8
9
10
2- type: Object
3 object:
4 metric:
5 name: 'http_requests'
6 selector: 'verb=GET'
7 target:
8 type: AverageValue
9 averageValue: 500
10
例2,设置指标的名称为http_requests,并且该资源对象具有标签 “verb=GET”, 在指标平均值达到500时触发扩缩容工作。
还可以在同一个HorizontalPodAutoscaler资源对象中定义多个类型的指标,系统将针对每种类型的指标都计算Pod副本的目标数量,以最大值为准进行扩缩容操作。例如:
2
3
4
5
6
7
8
9
10
11
12
13
14
15
16
17
18
19
20
21
22
23
24
25
26
27
28
29
30
31
32
33
34
35
36
37
2kind: HorizontalPodAutoscaler
3metadata:
4 name: tomcat-hpa
5 namespace: default
6spec:
7 scaleTargetRef:
8 apiVersion: apps/v1
9 kind: Deployment
10 name: tomcat-hpa
11 minReplicas: 1
12 maxReplicas: 10
13 metrics:
14 - type: Resource
15 resource:
16 name: cpu
17 target:
18 type: AverageUtilization
19 averageUtilization: 50
20 - type: Pods
21 pods:
22 metric:
23 name: packets-per-seceond
24 targetAverageValue: 1k
25 - type: Object
26 object:
27 metric:
28 name: requests-per-second
29 describedObject:
30 apiVersion: extensions/v1beta1
31 kind: Ingress
32 name: main-route
33 target:
34 kind: Value
35 value: 10k
36
37

不晓得是版本问题还是apiversion 不支持,一直报找不到一些字段。能自己解决的兄弟记得联系我哦。
从1.10版本开始,Kubernetes引入了对外部系统指标的支持。例如,用户使用了公有云服务商提供的消息服务或外部负载均衡器,希望基于这些外部服务的性能指标(如消息服务的队列长度、负载均衡器的QPS)对自己部署在Kubernetes中的服务进行自动扩缩容操作。这时,就可以在metrics参数部分设置type为External来设置自定义指标,然后就可以通过API“external.metrics.k8s.io”查询指标数据了。当然,这同样要求自定义Metrics Server服务已正常工作。
例3,设置指标的名称为queue_messages_ready,具有queue=worker_tasks标签在目标指标平均值为30时触发自动扩缩容操作:
2
3
4
5
6
7
8
9
2 external:
3 metric:
4 name: queue_message_ready
5 selector: "queue=worker_tasks"
6 target:
7 type: AverageValue
8 averageValue: 30
9
在使用外部服务的指标时,要安装、部署能够对接到Kubernetes HPA模型的监控系统,并且完全了解监控系统采集这些指标的机制,后续的自动扩缩容操作才能完成。
Kubernetes推荐尽量使用type为Object的HPA配置方式,这可以通过使用Operator模式,将外部指标通过CRD(自定义资源)定义为API资源对象来实现。
基于自定义指标的HPA实践
下面通过一个完整的示例,对如何搭建和使用基于自定义指标的HPA体系进行说明。
基于自定义指标进行自动扩缩容时,需要预先部署自定义Metrics Server,目前可以使用基于Prometheus、Microsoft Azure、Datadog Cluster等系统的Adapter实现自定义Metrics Server,未来还将提供基于Google Stackdriver的实现自定义Metrics Server。读者可以参考官网https://github.com/kubernetes/metrics/blob/master/IMPLEMENTATIONS.md\#custommetrics-api的说明。本节基于Prometheus监控系统对HPA的基础组件部署和HPA配置进行详细说明。
基于Prometheus的HPA架构如图所示:
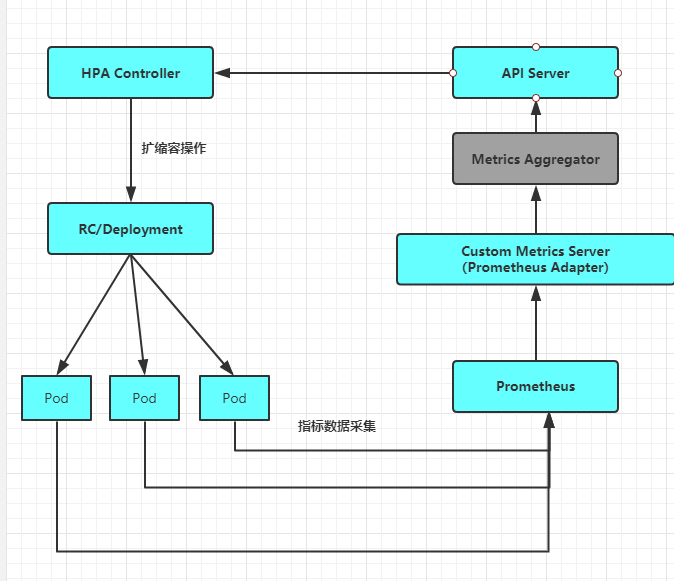
关键组件包括如下。
◎ Prometheus:定期采集各Pod的性能指标数据。
◎ Custom Metrics Server:自定义Metric Ssrver,用Prometheus Adapter进行具体实现。它从Prometheus服务采集性能指标数据,通过Kubernetes的Metrics Aggregation层将自定义指标API注册到Master的API Server中,以/apis/custom.metrics.k8s.io路径提供指标数据。
◎ HPA Controller:Kubernetes的HPA控制器,基于用户定义的HorizontalPodAutoscaler进行自动扩缩容操作。
接下来对整个系统的部署过程进行说明。
(1)在Master的API Server启动Aggregation层,通过设置kube-apiserver服务的下列启动参数进行开启。
◎ –requestheader-client-ca-file=/etc/kubernetes/ssl_keys/ca.crt:客户端CA证书。
◎ –requestheader-allowed-names= :允许访问的客户端common names列表,通过header中由–requestheader-username-headers参数指定的字段获取。客服端common names的名称需要在client-ca-file中进行配置,将其设置为空值时,表示任意客户端都可以访问。
◎ –requestheader-extra-headers-prefix=X-Remoto-Extra-:请求头中需要检查的前缀名。
◎ –requestheader-group-headers=X-Remote-Group:请求头中需要检查的组名。
◎ –requestheader-username-headers=X-Remote-User:请求头中需要检查的用户名。
◎ –proxy-client-cert-file=/etc/kubernetes/ssl_keys/kubelet_client.crt:在请求期间验证Aggregator的客户端CA证书。
◎ –proxy-client-key-file=/etc/kubernetes/ssl_keys/kubelet_client.key:在请求期间验证Aggregator的客户端私钥。
配置kube-controller-manager服务中HPA的相关启动参数(可选配置)如下。
◎ –horizontal-pod-autoscaler-sync-period=10s:HPA控制器同步Pod副本数量的时间间隔,默认值为15s。
◎ –horizontal-pod-autoscaler-downscale-stabilization=1m0s:执行缩容操作的等待时长,默认值为5min。
◎ –horizontal-pod-autoscaler-initial-readiness-delay=30s:等待Pod达到Ready状态的时延,默认值为30min。
◎ –horizontal-pod-autoscaler-tolerance=0.1:扩缩容计算结果的容忍度,默认值为0.1,表示[-10%-+10%]。
(2)部署Prometheus,这里使用Operator模式进行部署。
首先,使用下面的YAML配置文件部署prometheus-operator:
2
3
4
5
6
7
8
9
10
11
12
13
14
15
16
17
18
19
20
21
22
23
24
25
26
27
28
29
30
31
32
2kind: Deployment
3metadata:
4 name: prometheus-operator
5 labels:
6 k8s-app: prometheus-operator
7spec:
8 replicas: 1
9 selector:
10 matchLabels:
11 k8s-app: prometheus-operator
12 template:
13 metadata:
14 labels:
15 k8s-app: prometheus-operator
16 spec:
17 containers:
18 - image: quay.io/coreos/prometheus-operator:v0.26.0
19 imagePullPolicy: IfNotPresent
20 name: prometheus-operator
21 ports:
22 - containerPort: 8080
23 name: http
24 resources:
25 limits:
26 cpu: 200m
27 memory: 100Mi
28 requests:
29 cpu: 100m
30 memory: 50Mi
31
32
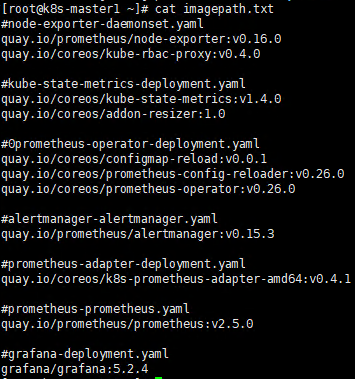
需要手动安装pull镜像包
2
3
4
5
6
7
8
9
10
11
12
13
14
15
16
17
18
19
20
21
22
23
24
25
26
2quay.io/prometheus/node-exporter:v0.16.0
3quay.io/coreos/kube-rbac-proxy:v0.4.0
4
5#kube-state-metrics-deployment.yaml
6quay.io/coreos/kube-state-metrics:v1.4.0
7quay.io/coreos/addon-resizer:1.0
8
9#0prometheus-operator-deployment.yaml
10quay.io/coreos/configmap-reload:v0.0.1
11quay.io/coreos/prometheus-config-reloader:v0.26.0
12quay.io/coreos/prometheus-operator:v0.26.0
13
14#alertmanager-alertmanager.yaml
15quay.io/prometheus/alertmanager:v0.15.3
16
17#prometheus-adapter-deployment.yaml
18quay.io/coreos/k8s-prometheus-adapter-amd64:v0.4.1
19
20#prometheus-prometheus.yaml
21quay.io/prometheus/prometheus:v2.5.0
22
23#grafana-deployment.yaml
24grafana/grafana:5.2.4
25
26
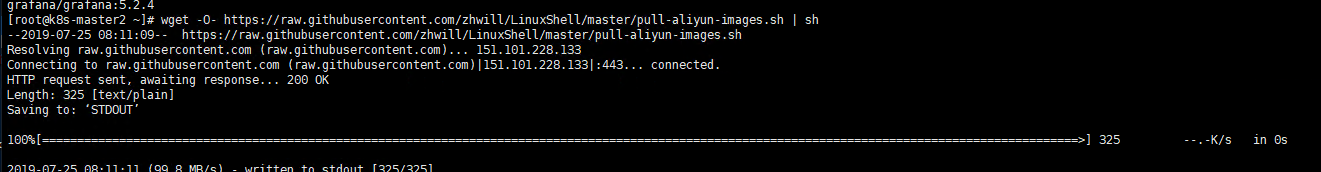
下载镜像包
2
2


重启之后就挂掉,暂时未解决。

这个prometheus-operator在自动创建名为monitoring.coreos.com的CRD资源时失败,导致容器无法重新启动。
小结:
目前遇到的问题,后面统一解决。。
谢谢大家的支持。
