nginx以高并发,省内存著称。
相信大多数安装nginx的同学都想知道自己的nginx性能如何。
我想跟大家分享下我使用ab工具的压力测试方法和结果,
ab是针对apache的性能测试工具,可以只安装ab工具。
ubuntu使用如下命令
apt-get install apache2-utils
测试之前需要准备一个简单的html、一个php、一个图片文件。
分别对他们进行测试。
我们把这个三个文件放到nginx安装目录默认的html目录下,

准备之后我们就可以测试了
ab -kc 1000 -n 1000 http://localhost/ab.html
这个指令会使用1000个并发,进行连接1000次。结果如下
root@SNDA-172-17-12-117:/usr/local/nginx# ab -kc 1000 -n 1000 http://www.nginx.c n/ab.html
This is ApacheBench, Version 2.3 <$Revision: 655654 $>
Copyright 1996 Adam Twiss, Zeus Technology Ltd, http://www.zeustech.net/
Licensed to The Apache Software Foundation, http://www.apache.org/
Benchmarking www.nginx.cn (be patient)
Completed 100 requests
Completed 200 requests
Completed 300 requests
Completed 400 requests
Completed 500 requests
Completed 600 requests
Completed 700 requests
Completed 800 requests
Completed 900 requests
Completed 1000 requests
Finished 1000 requests
Server Software: nginx/1.2.3
Server Hostname: www.nginx.cn
Server Port: 80
Document Path: /ab.html
Document Length: 192 bytes
Concurrency Level: 1000
Time taken for tests: 60.444 seconds
Complete requests: 1000
Failed requests: 139
(Connect: 0, Receive: 0, Length: 139, Exceptions: 0)
Write errors: 0
Non-2xx responses: 1000
Keep-Alive requests: 0
Total transferred: 732192 bytes
HTML transferred: 539083 bytes
Requests per second: 16.54 [#/sec] (mean)
Time per request: 60443.585 [ms] (mean)
Time per request: 60.444 [ms] (mean, across all concurrent requests)
Transfer rate: 11.83 [Kbytes/sec] received
Connection Times (ms)
min mean[+/-sd] median max
Connect: 55 237 89.6 261 328
Processing: 58 5375 13092.8 341 60117
Waiting: 57 5337 12990.0 341 59870
Total: 386 5611 13083.7 572 60443
Percentage of the requests served within a certain time (ms)
50% 572
66% 606
75% 635
80% 672
90% 30097
95% 42004
98% 47250
99% 49250
100% 60443 (longest request)
对于php文件和图片文件可以使用同样指令进行,结果我就不贴出来了。
ab -kc 500 -n 5000 http://localhost/ab.php
ab -kc 500 -n 5000 http://localhost/ab.gif
输出结果我们可以从字面意思就可以理解。
这里对两个比较重要的指标做下说明
比如
Requests per second: 16.54 [#/sec] (mean)
Time per request: 60443.585 [ms] (mean)
Requests per second表示当前测试的服务器每秒可以处理16.54个静态html的请求。
Time per request表示nginx收到用户请求,到给出响应页面要花费的时间。
你可以适当调节-c 和-n大小来测试服务器性能,借助htop指令来直观的查看机器的负载情况。
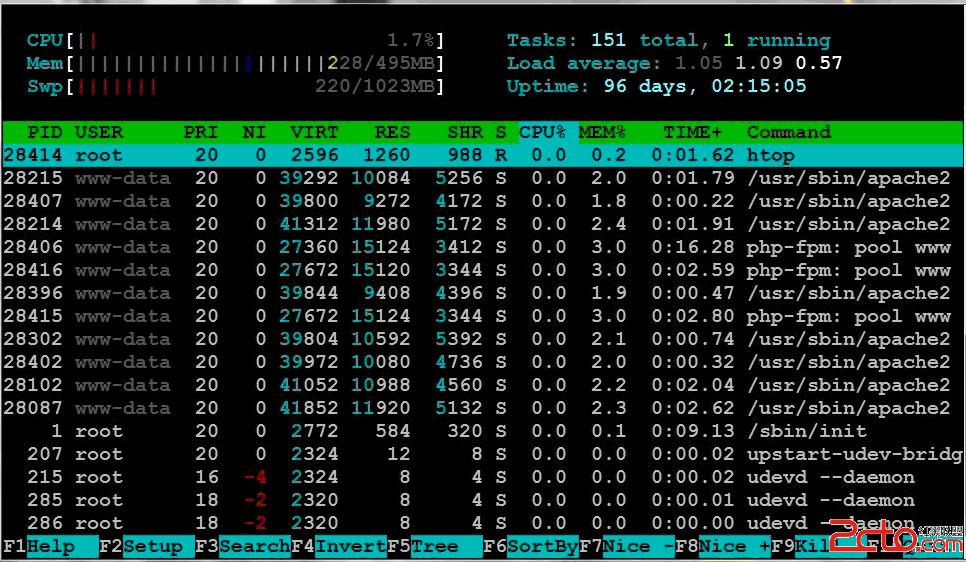
我的机器是盛大云的超微主机,平时负载cpu是1.7%,htop命令结果截图

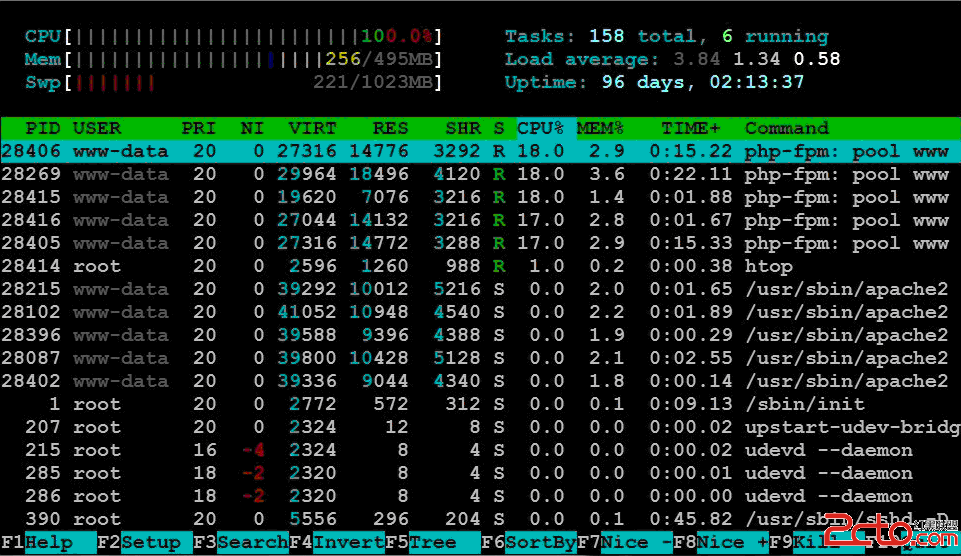
加压后的负载100%,负载基本已经上来了。htop命令结果截图

详细出处参考:http://www.nginx.cn/110.html
看来我需要好好优化一下,或者就换台机器了。
参考http://go2linux.garron.me/linux/2010/04/how-benchmark-stress-your-apache-nginx-or-iis-server-718
详细出处参考:http://www.nginx.cn/110.html
