释放双眼,带上耳机,听听看~!
Pyecharts概要
Pyecharts是一个基于Echarts JavaScript库的Python库,用于生成丰富的图表类型。它易于使用,可以创建多种精美的图表。
基础使用
- 通过pip命令安装Pyecharts库。
- 导入所需的模块,例如:
1from pyecharts.charts import Line
。
- 根据图表类型创建对象,如:
1line = Line()
。
- 设置图表数据和配置项,使用
1add_xaxis()
和
1add_yaxis()方法。
- 使用
1render()
方法渲染图表,生成HTML文件或显示在Jupyter Notebook中。
各类图形实现
介绍了如何实现柱状图、组合柱状图、3D柱状图、k线图、漏斗图、仪表盘、折线图、3D折线图、饼图、雷达图、散点图等多种图表类型。
2
3
4
5
6
7
8
9
10
11
12
13
14
15
16
17
18
19
20
from pyecharts.faker import Faker
from pyecharts import options as opts # 导入配置项
from pyecharts.globals import ThemeType, RenderType # 主题与渲染风格
c = (
Bar( # 初始化配置项:
init_opts=opts.InitOpts(
width='700px',
height='400px', # 图表画布的大小,css长度单位
page_title='网页标题', # html网页
theme=ThemeType.WHITE, # 主题颜色
bg_color='white' # 背景颜色
))
.add_xaxis(Faker.choose())
.add_yaxis("商家A", Faker.values())
.add_yaxis("商家B", Faker.values())
.render("InitOpts初始化配置项.html")
)
2
3
4
5
6
7
8
9
10
11
12
13
14
15
16
17
18
19
20
21
22
23
24
25
26
27
28
29
30
31
32
33
34
35
36
37
38
39
40
41
42
43
44
45
46
47
48
49
50
51
52
53
54
55
from pyecharts.faker import Faker
from pyecharts import options as opts # 导入配置项
from pyecharts.globals import ThemeType, RenderType
c = (
Bar( # 初始化配置项:
init_opts=opts.InitOpts(
width='700px',
height='400px', # 图表画布的大小,css长度单位
page_title='网页标题', # html网页
theme=ThemeType.WHITE, # 主题颜色
bg_color='white' # 背景颜色
))
.add_xaxis(Faker.choose())
.add_yaxis("商家A", Faker.values())
.add_yaxis("商家B", Faker.values())
.set_global_opts(
# TitleOpts标题配置项
title_opts=opts.TitleOpts(
title='主标题', # 主标题
title_link='http://www.baidu.com', # 主标题点击跳转
title_target='blank', # 默认为blank新窗口打开,self当前窗口打开
subtitle='副标题', # 副标题
subtitle_link='http://www.baidu.com', # 副标题点击跳转
subtitle_target='blank',
# 标题位置配置
pos_left='20px', # 默认值为5px 这里的值可以为 20%、left center、right
# pos_right
# pos_bottom
# pos_top
padding=10, # 内边距
item_gap=5, # 主标题与副标题的距离
),
# DataZoomOpts:区域缩放配置项
datazoom_opts=opts.DataZoomOpts(
is_show=True, # 默认Ture,是否显示组件
type_='slider', # 默认为拖动 slider、inside(滚动)
is_realtime=True, # 拖动时是否实时更新图表
range_start=20, # 数据窗口的起始百分比
range_end=80, # 数据窗口的结束百分比
orient='horizontal', # horizontal水平或vertical垂直
is_zoom_lock=False, # 是否锁定选择区域
)
)
# .render("标题与缩放配置项.html")
)
c.render_notebook()

2
3
4
5
6
7
8
9
10
11
12
13
14
15
16
17
18
19
20
21
22
23
24
25
26
27
28
29
30
31
32
33
34
35
36
37
38
39
40
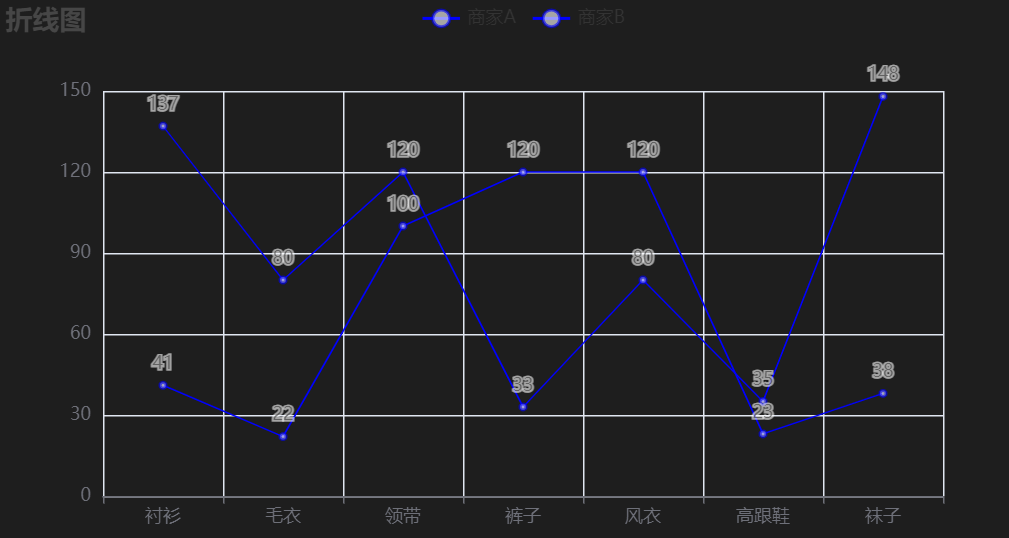
from pyecharts.faker import Faker
from pyecharts import options as opts # 导入配置项
c = (
Line( # 初始化配置项:
init_opts=opts.InitOpts(
width='700px',
height='400px', # 图表画布的大小,css长度单位
))
.add_xaxis(Faker.choose())
.add_yaxis("商家A", Faker.values())
.add_yaxis("商家B", Faker.values())
.set_global_opts(
title_opts=opts.TitleOpts(
title='折线图'
),
tooltip_opts=opts.TooltipOpts(
trigger='axis'
)
)
.set_series_opts(
# 图元样式
itemstyle_opts=opts.ItemStyleOpts(
# 图的颜色
# 使用纯色
# 使用RGB,rgb(120,120,120) 0-125
# 使用RGBA,rgba(120,120,120,0.5) 最后参数为透明度
# 十六进制:#ccc
color='blue',
# 透明度
opacity=0.6,
border_width=2, # 边框宽度
border_color='green', # 边框的颜色
),
)
# .render('系列配置项说明.html') # 这行代码不能写在前面
)
c.render_notebook()
详细说明:https://www.cnblogs.com/luoluoange/p/17787516.html
